An astounding database program to cover your whole school's needs
Viewpoint is the perfect database for students of KS3-4 Maths and ICT to study the data handling strand of the curriculum. The software can be used to collect, enter, analyse and evaluate quantitative and qualitative information. It provides an ideal opportunity for students to develop their knowledge, skills and understanding through practical activities. 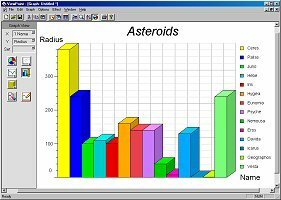  Viewpoint can be used to teach both Maths and ICT at KS3-4 but more than that, it is a data handling tool for use across the curriculum, in subjects like Geography, History, D&T, Science, PE, PSHE and Citizenship to provide students with opportunities to apply and develop ther ICT capability. Viewpoint provides: Viewpoint can be used to teach both Maths and ICT at KS3-4 but more than that, it is a data handling tool for use across the curriculum, in subjects like Geography, History, D&T, Science, PE, PSHE and Citizenship to provide students with opportunities to apply and develop ther ICT capability. Viewpoint provides:
- Impressive report, graphing and analysis tools
- Powerful form design and multimedia integration
- Fast searching and sorting
- Wonderful teaching resources and ideas
- Drag and drop relational database building.
- Allows you to import your favourite educational databases in these formats: PinPoint, Datapower, CSV, Key, Key+, Grass, Quest, Tab seperated
National Curriculum datafiles and support resources included for:
|
Mathematics files inc: Census, Traffic and Estate Agency
Science files inc: Minerals, Planets and Weather
CDT files inc: Clothes, Materials, Foods and Nutrients
RE files inc: Africa and Burial Register
PSHE files inc: Housing and Journey to School
|
|
ICT files inc: Address Book, Educational Websites and Web Notes
History files inc: Inventions, Monarchs and WWII
Geography files inc: Countries, Shopping Survey and World Economies
Modern Languages files inc: French, German, Spanish and English
|
|
Art Containing details of 20 popular artists
Music files inc: Composers and Musicians
PE files inc: Exercise survey, Sports Day and Facilities
Citizenship This new area has election data since 1900
|
  Why Viewpoint? Why Viewpoint?
For Teachers:
- Example files covering all National Curriculum subjects
- Free extra resources and sample files regularly updated on the Internet
- Pre-loaded files in your subject
- Teaching ideas, hints and tips in the manual - plus a fully integrated help function in the software
- Guidance on how to collect, manipulate and present data to your pupils.
For Pupils:
- User friendly - quick to master
- Simple to enter data including: numbers, sounds, pictures and words
- Capture, store, manipulate, interrogate and display data with accuracy and speed
- Will organise the data to find patterns and connections
- Allows easy searching for information on pre-loaded data
- Present findings in a variety of graphs & styles.
  For ICT Curriculum managers: For ICT Curriculum managers:
- Covers NC Handling Information skills from level 1- 8
- Easy to use file design features for students
- Can handle numerical, graphical, textual, audio and visual information
- Supports information handling skills across all subjects and for all levels of ability
- Enjoyable to use as it is fast, accurate, and adaptable.
For ICT Administration Managers:
- Powerful password protection, making the software suitable for confidential student data
- Ideal whole school solution
- Software can be stored, amended and shared by different individuals, according to password access
- Stores photographs of pupils.
Network Managers:
- Viewpoint provides the complete package to support report creation with:
- Questionnaire publication across your network
- Smart client/server operation for simultaneous users
- True multiple read/write access to your datafiles
- Up to date information across your network if you need it.
Viewpoint has four views:
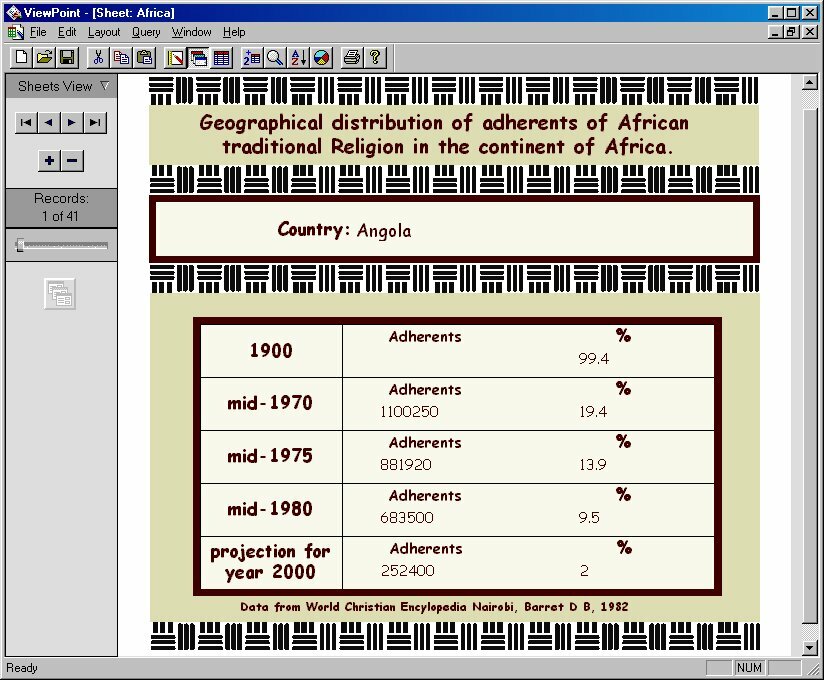
 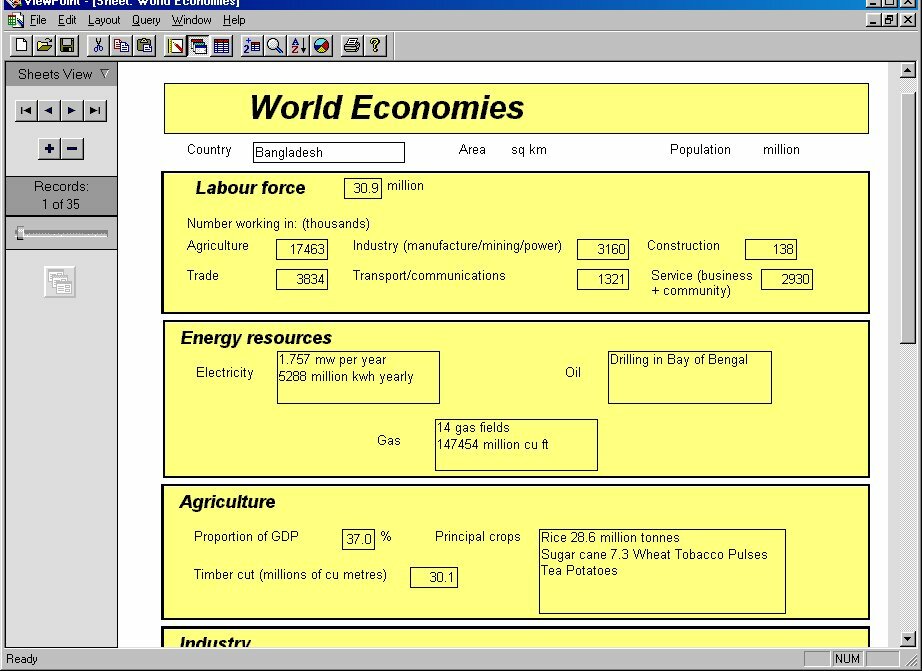 Sheets View Sheets View
- This is the main view of the information
- It displays the individual record cards
- You can enter new information
- You can alter or delete information
- You can sort existing information
- You can also perform simple searches.
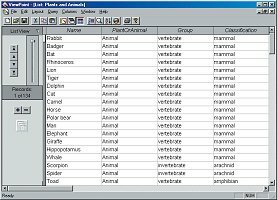
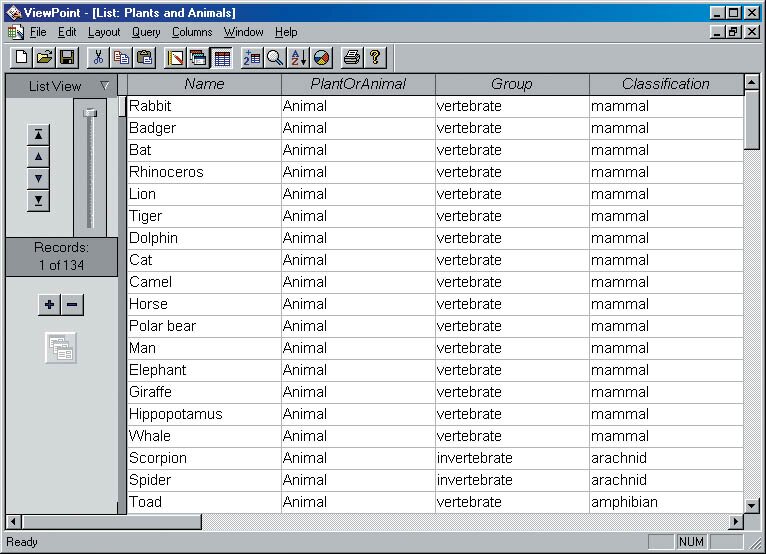
List view
- Shows all your data in table form for easy scanning
- Enter new information
- Alter or remove information
- Sort and search information
- Use the following statistical operations on particular fields: Sum, Count, Average, Minimum/Maximum
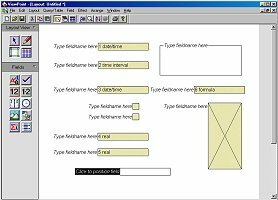 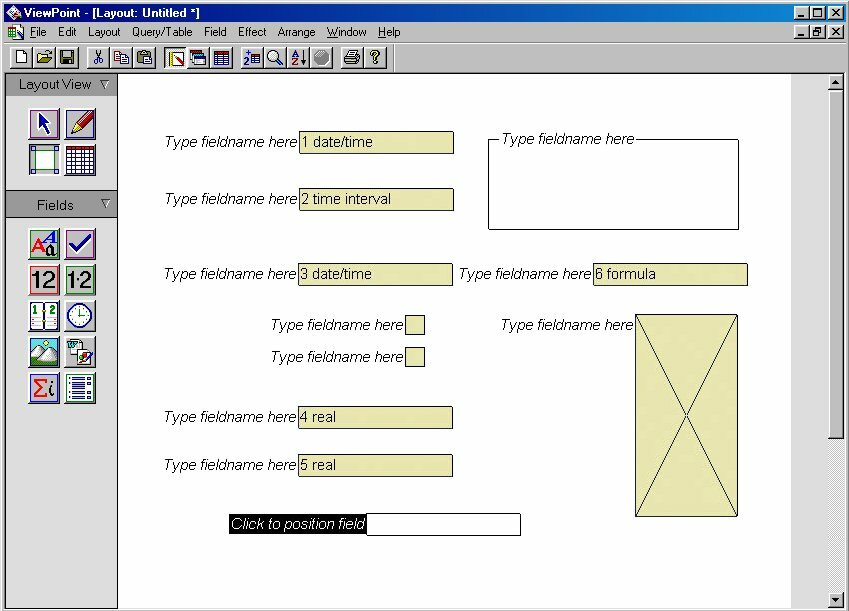 Layout View Layout View
- This is where you design your records
- You can add fields
- Specify what type of data each field is to hold
- Specify whether any rules are to be imposed on the data entered
- You decide the layout of the individual record cards
- You can define different layouts for your data.
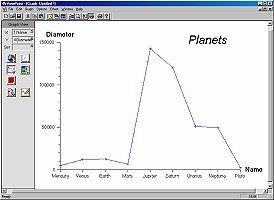
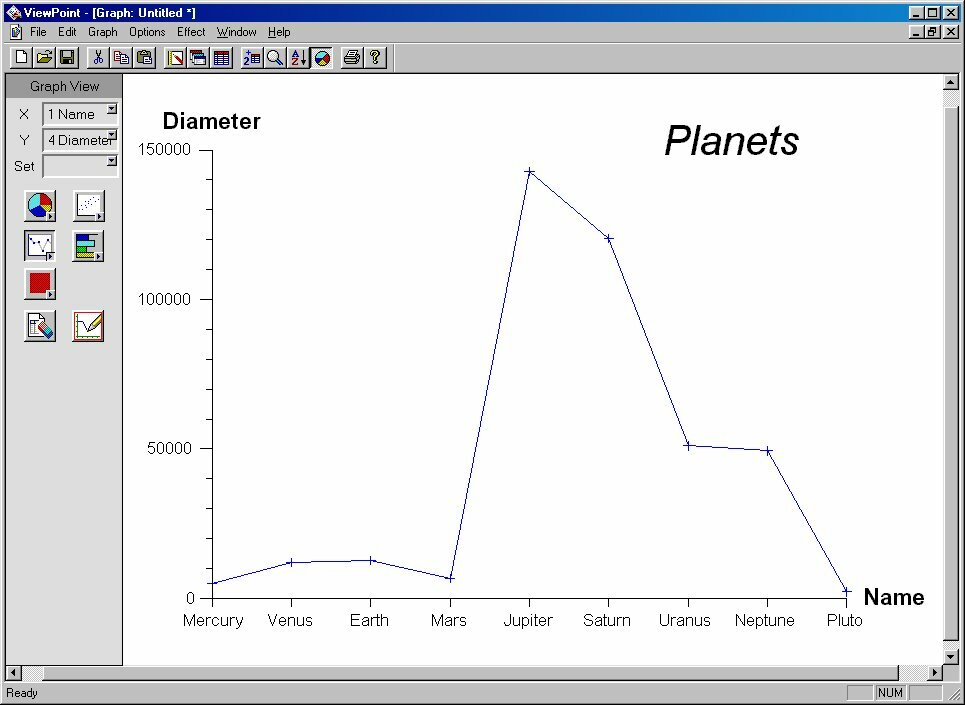
Graph View
- Plot pictorial views of your data
- A large range of graph types are available
- You can have control over the appearance of the graphs you produce
- You can refine your graph by changing the axis, adding a grid and a key or legend.
The key functions and features of Viewpoint:
Explore and Organise - Users discover information through their own investigations or utilising Viewpoint's extensive collection of over 60 curriculum datafiles.
- Pupils add their own sheets
- Save and store information
- Easy to make global data changes.
  Enquire and Collate - Using Viewpoint's curriculum based datafiles or their own data pupils can: Enquire and Collate - Using Viewpoint's curriculum based datafiles or their own data pupils can:
- Utilise existing datafiles for sorting, searching and filtering
- Navigate and edit records in sheet or table view
- Print, graph or save subsets for re-use.
Create and Evaluate - Viewpoint's powerful, intuitive and easy to use form designer allows users to create their own surveys, bringing them to life with integrated multimedia resources and live web links.
- Viewpoint supports both direct and 'drag & drop'data entry
- Users can choose nine different question types from open text to multiple choice.
- Construct relational databases
- Compare results sensibly
- Utilise the report, graphing and analysis tools to interrogate and present findings.
Sort and Search - Two dynamics ways in which to examine collected data:
- Text, or multiple choice fields
- Numeric, date or interval fields
- Sort or search more than one field
- Save and re-use a sort query
Report and Present - Viewpoint provides the complete package to support report creation with:
- Drag and drop features
- Excellent display qualities
- Exporting to other applications as graphics or text files
- Powerful form designer.
- Built in graphing
- Range of graphs including normal, stacked, clustered and frequency
- Display features in 2D and 3D
- A grid and key can be added to any graph
- Text on graph can be moved or altered.
|
|


